
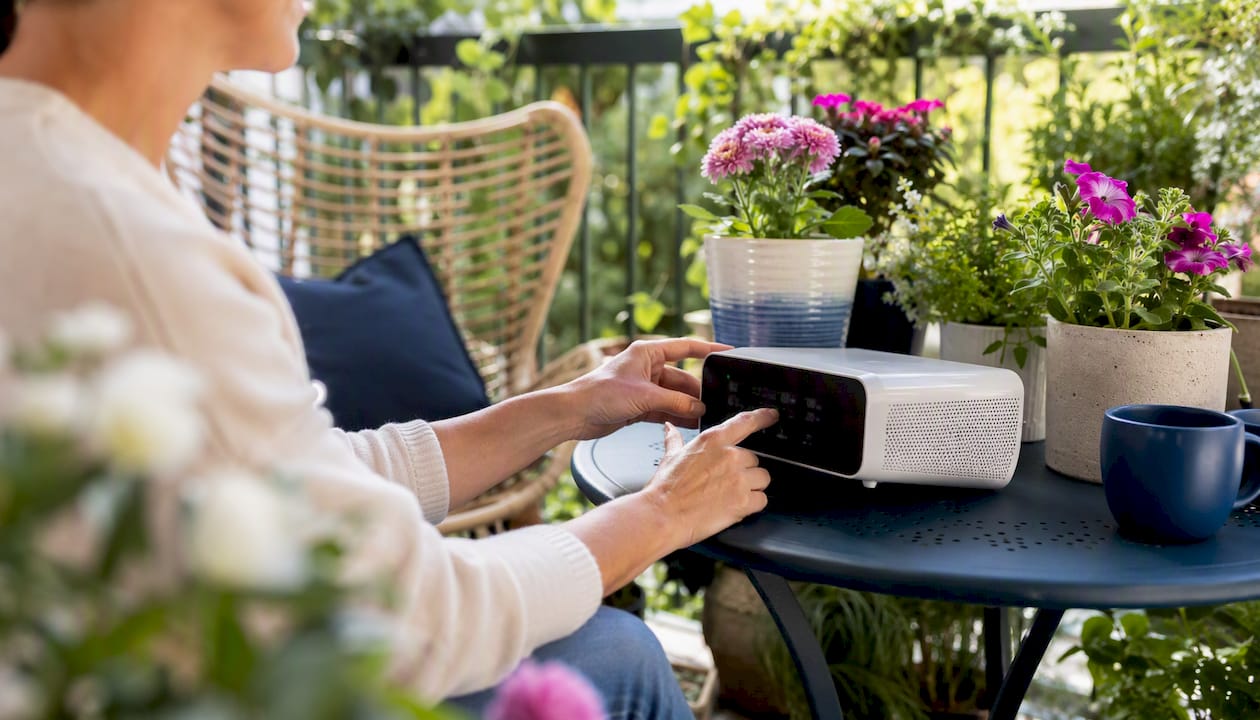
The Air Quality Index (AQI) is a single, colour-coded number that converts outdoor pollution measurements into a clear health signal. Low numbers mean the air is safe for most people; high numbers mean you should reduce exposure, particularly outdoors. The scale runs from 0 to 500, with six categories from “Good” to “Hazardous”, according to AQI Basics from AirNow.
Here is the bottom line by band:
- AQI 0–50 (Good): No restrictions. Go about your day normally.
- AQI 51–100 (Moderate): Acceptable for most people. Unusually sensitive individuals may notice mild symptoms during prolonged outdoor exertion.
- AQI 101–150 (Unhealthy for Sensitive Groups): Children, older adults, pregnant people, and those with certain health conditions should limit extended outdoor activity; the general public is less likely to be affected.
- AQI 151+ (Unhealthy to Hazardous): Everyone should reduce outdoor activity. Stay indoors with windows closed and run a HEPA air purifier if you have one.
Pro Tip: Outdoor AQI tells you nothing about what you are breathing inside. Indoor sources — cooking fumes, cleaning sprays, pet dander, and mould — can push indoor particle levels well above the outdoor reading, even on a “Good” day. If you live with pets or have recently renovated, your indoor air may be the bigger concern. A home air quality monitor will show you what the AQI number cannot.
Key takeaways
The Air Quality Index converts raw pollutant concentrations into a single number from 0 to 500, and the highest single-pollutant sub-index always determines the overall AQI score.
| Point | Details |
|---|---|
| AQI scale and categories | The scale runs 0–500 across six colour-coded bands, from Good (0–50) to Hazardous (301+). |
| Highest sub-index rule | Overall AQI equals the worst single pollutant sub-index; one bad reading drives the whole number. |
| PM2.5 is the key threat | Fine particles under 2.5 µm penetrate deep into the lungs; bushfire smoke is the main Australian source. |
| Where to check in Australia | Use your state EPA site for accurate local data; AQICN for a national overview; BOM during fire season. |
| Pureair-au for indoor protection | AHAM-verified HEPA purifiers and humidity control reduce indoor PM2.5 when outdoor AQI is poor. |
Table of Contents
- How is the air quality index actually calculated?
- The six pollutants that feed most AQI readings
- How Australian AQI reporting relates to WHO guidance
- Where to check current AQI across Australia
- What AQI numbers actually mean for your health
- What to do when AQI is poor
- Why AQI in Australia deserves more attention than it gets
- Protect your indoor air when outdoor AQI rises
- Sources
How is the air quality index actually calculated?
Think of the AQI as a thermometer for pollution. NESDIS/NOAA describes it as a tool that converts raw pollutant concentrations, measured over a defined averaging period, into a single index value anyone can read at a glance.
The calculation works in three steps:
- Monitors measure the concentration of each pollutant in micrograms per cubic metre (µg/m³) or parts per million.
- Each concentration is converted into its own sub-index using a standardised formula tied to health breakpoints.
- The overall AQI equals the highest single sub-index. One bad pollutant drives the whole number, regardless of how clean everything else is.
Different pollutants use different averaging windows because health effects work on different timescales. PM2.5 and PM10 are typically averaged over 24 hours. Ozone (O3) uses an 8-hour average. Carbon monoxide (CO) also uses an 8-hour window. Sulphur dioxide (SO2) is assessed over one hour. These windows reflect how quickly each pollutant causes harm.
Illustrative example: A PM2.5 reading of 35.5 µg/m³ over 24 hours maps to an AQI sub-index of approximately 100, placing it at the top of the “Moderate” band. If ozone on the same day produces a sub-index of 65, the reported AQI is 100, driven by PM2.5.
Wikipedia’s air quality index entry confirms this “highest sub-index wins” rule is the standard approach used across most national systems.
The six pollutants that feed most AQI readings
AirNow’s guidance on using the AQI notes that ozone and particle pollution are the most common drivers of the index. Here is what each of the six major pollutants does and where it comes from:
- PM2.5 — Fine particles smaller than 2.5 micrometres in diameter. Sources include bushfire smoke, wood heaters, and vehicle exhaust. Because they are so small, they bypass the nose and throat and lodge deep in the lungs, entering the bloodstream. This is the pollutant Australians most often encounter at dangerous levels during fire season.
- PM10 — Coarser particles up to 10 micrometres. Dust storms, pollen, and construction sites are common sources. Less penetrating than PM2.5 but still irritating to airways.
- O3 (Ozone) — Forms when vehicle and industrial emissions react with sunlight. Peaks on hot, sunny afternoons in cities. A strong respiratory irritant even at moderate concentrations.
- NO2 (Nitrogen dioxide) — Produced by traffic and gas appliances. High concentrations inflame airways and worsen asthma. Also a significant indoor source if you cook with gas.
- SO2 (Sulphur dioxide) — Mainly from coal-fired power stations and industrial processes. Can trigger asthma attacks at relatively low concentrations.
- CO (Carbon monoxide) — Produced by incomplete combustion. Dangerous in enclosed spaces; outdoor levels rarely reach hazardous thresholds in Australia except near heavy traffic.
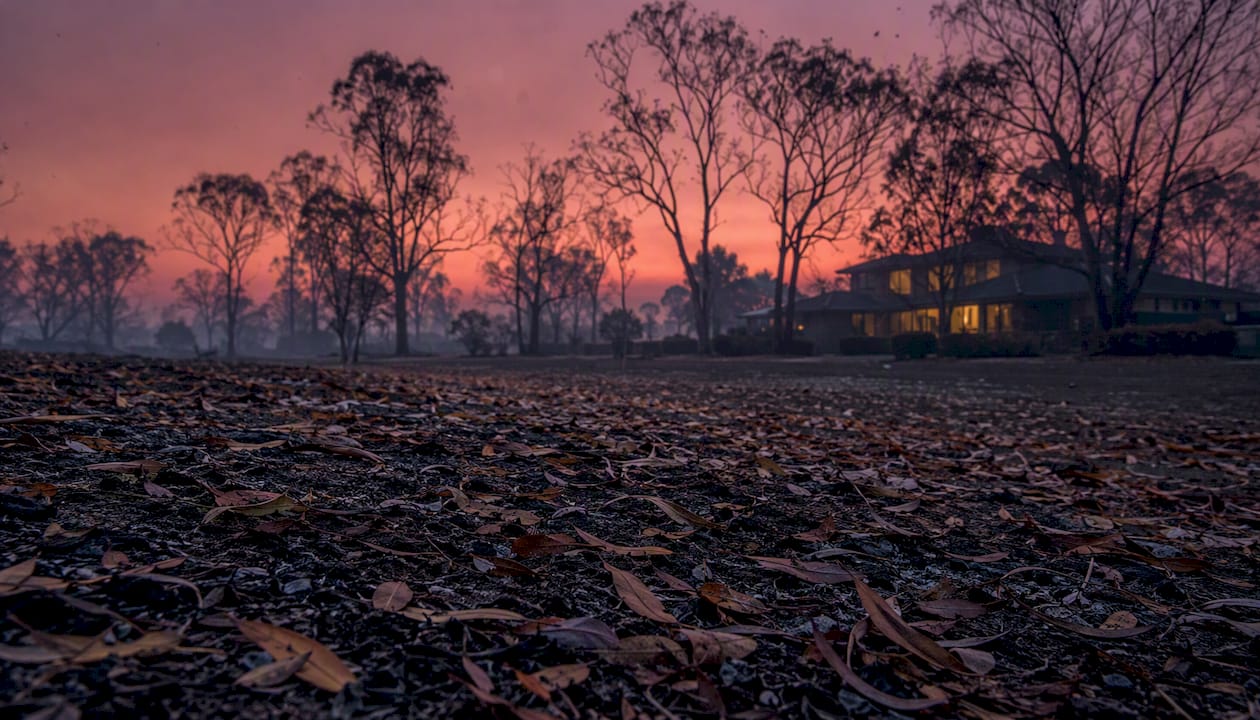
PM2.5 deserves special attention. The “2.5” refers to the particle diameter in micrometres — roughly 30 times finer than a human hair. Concentrations are expressed in µg/m³, meaning micrograms of particles per cubic metre of air. During a severe bushfire event, PM2.5 readings in Australian cities can spike from single digits to well above 200 µg/m³ within hours. Wood heaters in winter suburbs produce a similar, localised effect.
Pro Tip: During bushfire season, check PM2.5 specifically, not just the overall AQI. Some reporting platforms show the dominant pollutant alongside the index number. If PM2.5 is driving a reading above 100, close windows immediately — even a brief period of outdoor exposure can irritate airways for hours afterward.
Seasonal patterns matter here. Bushfires push PM2.5 to extreme levels in summer and autumn. Dust storms lift PM10 across inland and coastal areas in spring. Winter wood-heater smoke raises PM2.5 in cooler southern cities overnight. Traffic-related NO2 and O3 peak in summer in Sydney and Melbourne.
How Australian AQI reporting relates to WHO guidance
Australia does not use a single national AQI scale identical to the US system. State environment agencies report air quality using their own indices and categories, though the underlying measurement and calculation principles are consistent. The Western Australia Department of Water and Environmental Regulation (WA DER) publishes a clear explanation of how AQI is presented locally, including the categories and health advice used in that state.
The WHO’s ambient air pollution fact sheet-air-quality-and-health) states that most of the world’s population breathes air that does not meet WHO guideline values, and that nine out of ten people are exposed to air exceeding WHO recommendations. The WHO provides guideline values and interim targets for key pollutants, aiming to encourage gradual, measurable improvements even when full guideline achievement is challenging.
Why this matters for Australians: WHO’s 2021 guideline for annual mean PM2.5 is 5 µg/m³. Many Australian cities meet this on most days, but bushfire events and wood-heater smoke regularly push short-term concentrations far above it. The WHO interim targets acknowledge this gap and give governments and individuals a practical framework for improvement, even when the full guideline is out of reach during extreme events.
The gap between a national AQI threshold and a WHO guideline value is not a contradiction. National thresholds reflect regulatory and practical realities; WHO guidelines represent the health ideal. When your state’s AQI reads “Good,” the air may still exceed the WHO annual mean target during a prolonged smoke event. Reliable monitoring data from WHO’s air pollution topic page underscores that continuous, quality-assured measurements from fixed monitoring stations are what make trustworthy AQI values possible in the first place.
Australia’s National Environment Protection Measure (NEPM) for Ambient Air Quality sets the national standards that state agencies monitor against. State agencies including WA DER, NSW EPA, and VIC EPA each operate monitoring networks and publish real-time data aligned to these standards.
Where to check current AQI across Australia
Several reliable sources cover different needs. Use more than one during fire season.
Government state environment sites (best for local accuracy):
- WA DER Air Quality Index — Real-time readings for Perth and regional WA, with health advice and alert notifications. The most authoritative source for Western Australian conditions.
- NSW EPA Air Quality — Live monitoring data for Sydney and regional NSW, including hourly readings and health categories.
- VIC EPA AirWatch — Real-time data for Melbourne and Victoria, with a clear map interface and health guidance per category.
- SA EPA Air Quality — Covers Adelaide and key South Australian sites.
Global and real-time maps:
- AQICN (World Air Quality Index project) provides a live global map with city-level AQI pages for Australian locations. Excellent for a rapid overview and for comparing conditions across cities. Note that AQICN aggregates data from multiple sources and can differ slightly from local state networks due to varying monitor density and data processing methods.
- AirNow is a US-based platform, but its explanatory model and health guidance categories are widely referenced internationally and useful for understanding how AQI categories translate to health risk.
Bureau of Meteorology (BOM) smoke forecasts:
During bushfire season, BOM publishes smoke forecasts and fire weather outlooks that complement real-time AQI data. BOM forecasts indicate likely smoke travel over the coming 24–48 hours, giving you time to prepare before AQI deteriorates. Check the BOM website directly for the current smoke and fire weather forecast for your state.
Pro tip for daily use: State environment agency sites give the most accurate local readings because they draw on quality-assured, fixed monitoring stations. AQICN is faster for a broad national picture. BOM is the go-to during active fire events when conditions can change within hours.
What AQI numbers actually mean for your health
AirNow’s category guidance pairs each AQI band with specific health statements and identifies which groups are affected first. Here is how the bands translate to real-world risk:
- 0–50 (Good): Air quality poses little or no risk. Safe for all outdoor activity.
- 51–100 (Moderate): Acceptable for most people. Unusually sensitive individuals may notice mild symptoms during prolonged outdoor exertion.
- 101–150 (Unhealthy for Sensitive Groups): Children, older adults, pregnant people, and those with certain health conditions should limit extended outdoor activity when AQI indicates elevated pollution; the general public is less likely to be affected.
- 151–200 (Unhealthy): Everyone may begin to experience health effects. Sensitive groups face more serious risks. Reduce outdoor exertion; move exercise indoors.
- 201–300 (Very Unhealthy): Health alert. Everyone should avoid prolonged outdoor activity. Sensitive groups should stay indoors.
- 301–500 (Hazardous): Emergency conditions. The entire population is at risk. Stay indoors, keep windows closed, and run air filtration.
The groups most at risk from elevated AQI are consistent across the research. A WHO science and policy summary documents that air pollution is linked to approximately 6.6 million deaths annually, with health effects spanning the cardiovascular, respiratory, and neurological systems. Children are particularly vulnerable because their lungs are still developing and they breathe more air relative to their body weight. Older adults face compounded risk from reduced lung capacity and higher rates of pre-existing cardiovascular disease. Pregnant people face risks to foetal development. People with asthma, COPD, or ischaemic heart disease can experience acute exacerbations even at moderate AQI levels.
Symptoms to watch for during elevated AQI include eye and throat irritation, coughing, shortness of breath, and chest tightness. If a child or older adult develops wheezing, difficulty breathing, or chest pain during a high-AQI event, seek medical attention promptly rather than waiting for the AQI to improve.
Pro Tip: Do not wait for AQI to reach “Unhealthy” before acting if you or someone in your household is in a sensitive group. Symptoms often appear at “Unhealthy for Sensitive Groups” (101–150). If a child with asthma starts coughing more than usual on a moderate-AQI day, treat it as a signal to move indoors and check their medication, not a reason to wait and see. For parents, a child bedroom air quality checklist is a practical starting point.
What to do when AQI is poor
Immediate steps
- Stay indoors and keep windows and doors closed. This alone significantly reduces particle infiltration.
- Switch your car’s ventilation to recirculation if you must drive during a smoke or pollution event. Fresh-air mode draws outside air directly into the cabin.
- Reduce physical exertion outdoors. Exercise increases breathing rate and depth, pulling more pollutants into the lungs. Move workouts inside.
- Follow local health alerts. State environment agencies and BOM issue health advisories during severe events. Sign up for email or SMS alerts where available.
Indoor measures
Closing the building envelope helps, but it is not enough on its own. Indoor particle levels can still rise during prolonged smoke events as air infiltrates through gaps. A A HEPA air purifier sized correctly for the room is among the most effective ways to reduce indoor PM2.5 during a high-AQI event. HEPA filters capture approximately 99.97% of airborne particles at 0.3 micrometres, which includes PM2.5 and most biological particles. For practical guidance on sizing and placement, the steps to filter indoor air pollution page covers the key decisions.
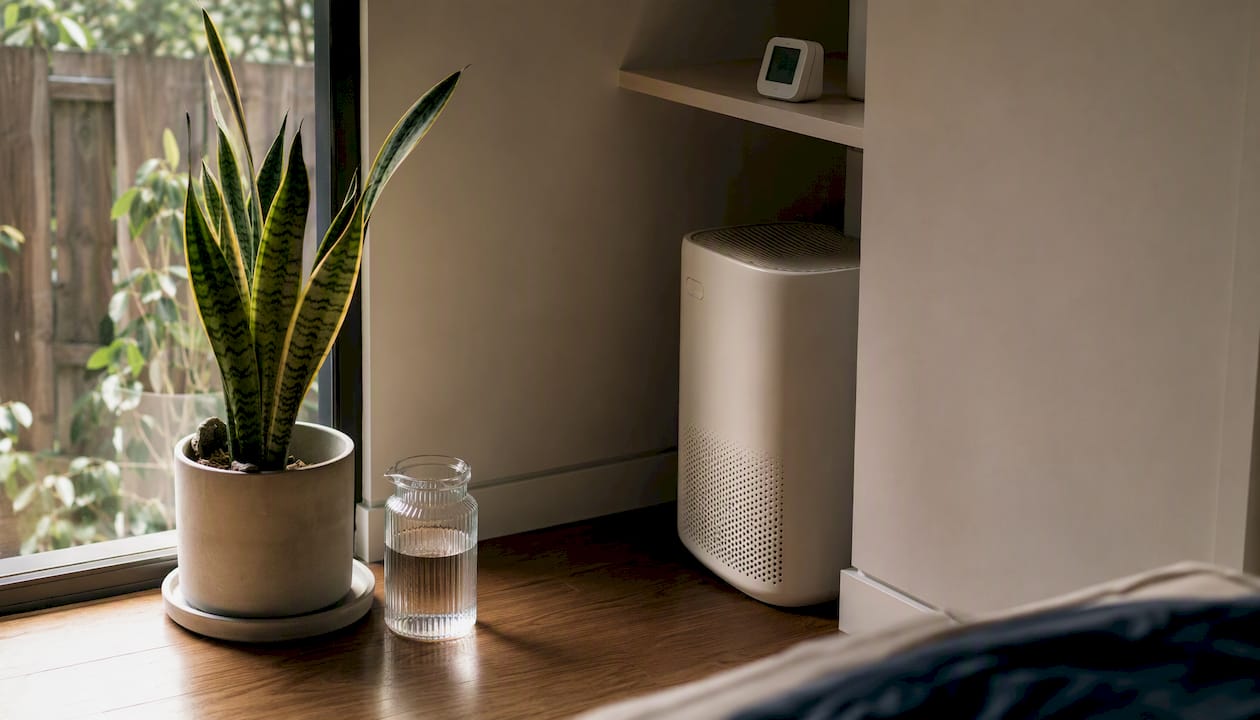
Humidity also matters. Dry air during fire season can worsen airway irritation, while excessive humidity promotes mould growth, which adds its own particle load. Keeping indoor relative humidity between 40% and 60% reduces both risks. The role of humidity in air quality explains how to manage this in Australian homes, where conditions swing between extremes depending on season and location.
Personal protection
P2 or N95 respirator masks, worn with a proper seal, reduce PM2.5 inhalation during short outdoor exposures. Surgical masks and cloth face coverings do not filter fine particles effectively. Fit matters: a mask that gaps at the sides provides little protection. Masks are most useful for brief, unavoidable outdoor exposure, not as a substitute for staying indoors during a hazardous event.
When to seek medical help
Anyone with asthma, COPD, or heart disease should have an action plan agreed with their GP before fire season. During a high-AQI event, use preventer medications as prescribed and have reliever medication accessible. Seek medical attention if symptoms do not improve after moving indoors, or if breathing difficulty, chest pain, or confusion develops.
Pro Tip: Practitioners working in Australian homes during fire season consistently find that the combination of a well-sealed building, a correctly sized Running a HEPA purifier continuously, along with maintaining humidity in the 40–60% range, tends to produce the most reliable reduction in indoor PM2.5. Running a purifier only when you notice smoke smell is too late — particles infiltrate before the smell does. Run it continuously during any event where outdoor AQI exceeds 100.
Why AQI in Australia deserves more attention than it gets
The AQI number is easy to dismiss on a clear day. Sydney reads “Good,” Melbourne reads “Moderate,” and most people carry on without a second thought. The problem is that Australia’s air quality story is not a steady-state one. It is punctuated by events — bushfire seasons that turn major cities grey for weeks, dust storms that roll across the inland and hit coastal suburbs without warning, and the slow, chronic background of wood-heater smoke in winter suburbs that rarely triggers a headline but accumulates over months.
What the AQI does not tell you is what is happening inside your home. That gap is where most Australians are underserved. Outdoor monitoring networks are excellent and improving. Indoor air quality, where Australians spend the vast majority of their time, remains largely unmeasured and underappreciated. The assumption that “indoors is safe” during a smoke event is not always correct, particularly in older homes with poor sealing or in households that cook with gas, burn candles, or have pets.
The practical implication is that understanding the AQI is only half the job. The other half is knowing how to respond indoors, with the right filtration, the right humidity management, and the right timing. Pureair-au’s AHAM-verified products and Smart Finder tool exist precisely for that second half.
Protect your indoor air when outdoor AQI rises
When outdoor AQI climbs, your home is your best defence, but only if the air inside it is clean. Pureair-au stocks medical-grade HEPA air purifiers, humidifiers, and dehumidifiers chosen specifically for Australian conditions, from bushfire smoke events to humid coastal summers. Every product is AHAM verified, meaning the performance claims are independently tested, not just marketing copy.
The Smart Finder tool on the Pureair-au website matches you to the right unit based on your specific concern, whether that is bushfire smoke, allergies, mould, pet dander, or a combination. HEPA filtration is thought to capture about 99.97% of airborne particles, including PM2.5. Paired with a humidifier or dehumidifier to keep indoor humidity in the 40–60% range, it is the most practical indoor response to a poor-AQI day. Browse the full range and find the right unit for your home at the Pureair-au product catalogue.
Sources
These are the authoritative sources referenced throughout this article. Each serves a different purpose.
- Airnow
- How Is Air Quality Measured? | NESDIS
- Air quality index | Department of Water and Environmental Regulation (WA)
- Air Pollution in Australia: Real-time Air Quality Index (AQI) | AQICN
- Air quality index — Wikipedia
This article is general information, not a substitute for advice from a qualified doctor. Consult a qualified healthcare professional about your own circumstances before acting on anything here.