

Air quality monitors are defined as devices that measure airborne pollutants and particulate matter to help allergy sufferers identify and reduce environmental triggers. The role of air quality monitors for allergy management is to turn invisible threats into readable data you can act on. The Environmental Protection Agency’s Air Quality Index classifies pollutant severity across six colour-coded categories, and even a moderate AQI score of 51–100 triggers symptoms in sensitive people. That means allergy sufferers are at risk well before air quality reaches levels most people consider dangerous. Pureair-au exists precisely to help Australian families bridge that gap between awareness and action.
How do air quality monitors detect allergens and pollutants related to allergies?
Air quality monitors work by combining multiple sensors to build a picture of what you are breathing. No single sensor catches everything, but a well-designed multi-sensor device covers the pollutants most likely to worsen allergy symptoms.
The core sensors found in advanced monitors include:
- PM2.5 and PM10 sensors: These measure fine and coarse particulate matter. PM2.5 particles are smaller than 2.5 micrometres and penetrate deep into the airways. PM10 captures larger particles like dust and some pollen fragments.
- VOC sensors: Volatile organic compounds come from cleaning products, furniture, and paints. High VOC levels irritate the airways and amplify allergic responses.
- CO2 sensors: Elevated CO2 signals poor ventilation. Poor ventilation concentrates every other pollutant in the room.
- Humidity sensors: Dust mites thrive above 50% relative humidity. Mould spores become airborne when humidity is consistently high.
Direct pollen detection is not yet standard in consumer monitors. Most devices measure pollen indirectly through PM10 readings, since pollen grains fall within that size range. Multi-sensor monitors that track VOCs, humidity, and CO2 together give you a far more complete picture of your home’s allergy risk than any single-pollutant device.
Sensor accuracy depends heavily on placement. A monitor sitting next to an open window or directly above a gas cooktop will read pollution spikes that do not reflect the air in your breathing zone. Placement away from windows and direct pollutant sources is the single most important factor in getting readings that actually reflect what you are inhaling.
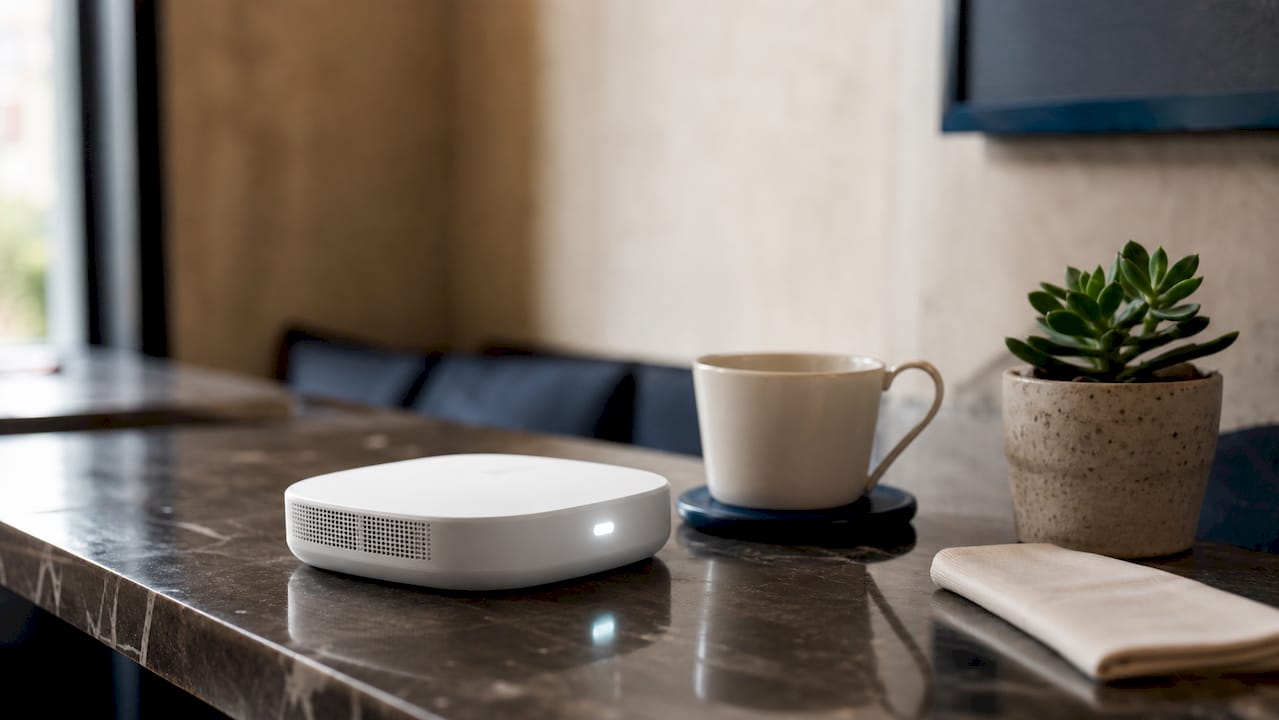
Pro Tip: Place your monitor at breathing height, roughly 1–1.5 metres off the floor, in the room where you spend the most time. Bedroom readings matter most for allergy sufferers because that is where you spend six to eight hours every night.
What scientific evidence supports the impact of air quality on allergy symptoms?
The science connecting air pollution and allergy severity is clear and consistent. A prospective observational study tracking PM2.5 and PM10 levels in 145 patients over one year found a strong positive correlation between pollutant levels and allergy symptom severity, with a correlation coefficient of r = 0.62 (p < 0.001). That figure means higher pollution reliably predicts worse symptoms, not occasionally but consistently across the full study period.
The EPA’s AQI framework puts this into practical context. The table below shows how each category affects allergy sufferers specifically.
| AQI category | AQI range | Effect on allergy sufferers |
|---|---|---|
| Good | 0–50 | Minimal risk for most people |
| Moderate | 51–100 | Sensitive individuals may notice symptoms |
| Unhealthy for sensitive groups | 101–150 | Allergy and asthma outcomes worsen noticeably |
| Unhealthy | 151–200 | Most people experience respiratory effects |
| Very unhealthy | 201–300 | Serious risk; outdoor exposure should be avoided |
| Hazardous | 301+ | Emergency conditions for all groups |
Ozone adds another layer of complexity. Research using in vivo and in vitro models found that ozone alters pollen allergenicity in a dose-dependent way. At moderate ozone concentrations of 80 parts per billion, ragweed pollen becomes more inflammatory. At higher concentrations of 120 parts per billion, some allergenic compounds degrade. This means the relationship between ozone and allergy risk is not linear, and monitoring ozone levels alongside pollen counts gives a more accurate picture of your actual risk on any given day.
“Pollutants like PM2.5, PM10, NO2, and ozone damage airway epithelial integrity, increasing mucosal permeability and facilitating allergen penetration. This is why pollution does not just add to allergy symptoms. It actively makes the airway more vulnerable to every allergen it encounters.” — Frontiers in Allergy, 2026
This mechanism explains why allergy sufferers in urban areas often report worse symptoms on high-pollution days even when pollen counts are unchanged. The pollution is not the allergen. It is the factor that makes allergens hit harder.
How can air quality monitors be used practically to manage allergy symptoms at home?
Air quality monitoring shifts allergy management from reactive to proactive. Instead of waiting for symptoms to appear, you use data to act before the trigger reaches a harmful level. Here is how to build that habit at home.
-
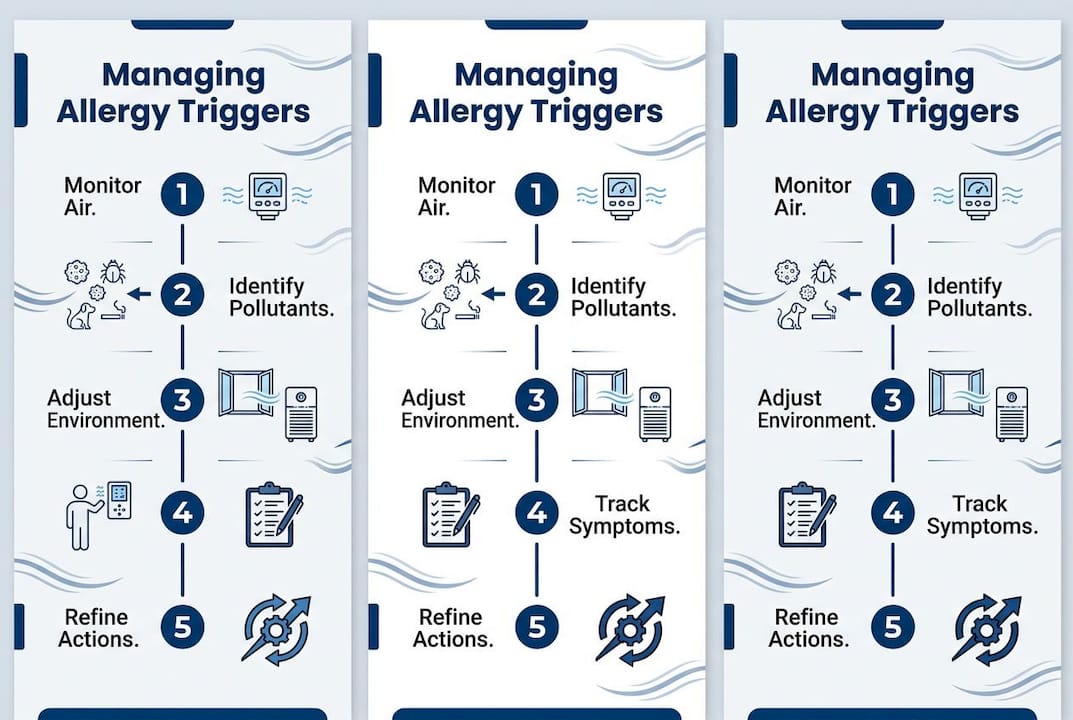
Log your readings alongside your symptoms. Most monitor apps allow you to export data. Keep a simple diary noting your symptom severity each morning and evening. After two to three weeks, patterns emerge. You may find that your worst mornings follow nights when indoor humidity exceeded 55%, or that headaches correlate with VOC spikes after cleaning.
-
Set threshold alerts. Configure your monitor to notify you when PM2.5 exceeds a level that historically precedes your symptoms. This removes the need to check the app constantly and gives you time to close windows or activate your air purifier before symptoms begin.
-
Automate your air purifier. Smart home integration that links monitors to air purifiers or ventilation systems improves allergy management compared to manual monitoring. When your monitor detects a PM2.5 spike, a connected purifier activates automatically. You do not need to be awake or even home for it to work.
-
Adjust for seasons. In spring, pollen drives PM10 readings up. In summer, bushfire smoke pushes PM2.5 into dangerous ranges. In winter, closed windows concentrate VOCs and CO2 indoors. Recognising these seasonal patterns helps you reduce indoor allergens before they peak.
-
Monitor your bedroom separately. The bedroom deserves its own device. You breathe that air for roughly a third of every day, and your body does most of its repair work during sleep. A poor bedroom reading that goes unnoticed is a significant missed opportunity.
Pro Tip: If your symptoms consistently improve when you spend time in a filtered or air-conditioned space, that is a strong signal that environmental pollutants are a primary driver of your allergy burden, not just outdoor pollen.
What are the benefits and limitations of air quality monitors for allergy sufferers?
Air quality monitors deliver genuine value for allergy management, but they work best when you understand what they can and cannot do.
Key benefits:
- Real-time awareness: You see pollution levels as they change, not hours later. This lets you act before symptoms escalate.
- Trigger identification: Correlating air quality data with symptom patterns helps you pinpoint specific triggers in your home environment.
- Preventive control: Monitors support decisions about when to run an air purifier, when to keep windows closed, and when to use a dehumidifier. This is proactive management, not guesswork.
- Measurable improvement: After installing filtration or improving ventilation, your monitor shows whether the intervention actually worked. You get objective feedback, not just a feeling.
Key limitations:
- No direct allergen identification: Consumer monitors cannot tell you whether the PM10 reading is pollen, dust, or pet dander. They measure particle size, not particle type.
- Calibration drift: Sensors lose accuracy over time. Most manufacturers recommend recalibration or sensor replacement every one to two years.
- Not a medical substitute: A monitor does not replace an allergy test, a diagnosis, or a treatment plan. It complements medical management. It does not replace it.
When choosing a monitor, consider whether you need a basic single-room device or a multi-sensor unit that tracks VOCs, humidity, and CO2 alongside particulate matter. Families with children or multiple allergy sufferers benefit most from medical-grade air filtration paired with a capable multi-sensor monitor. The monitor tells you what is in the air. The purifier removes it.
Key takeaways
Air quality monitors give allergy sufferers the real-time data needed to identify triggers, take preventive action, and measure whether their interventions are working.
| Point | Details |
|---|---|
| Monitors detect key pollutants | PM2.5, PM10, VOCs, humidity, and CO2 sensors together reveal the full allergy risk picture indoors. |
| Pollution amplifies allergen impact | PM2.5 and ozone damage airway linings, making allergens penetrate more deeply and trigger stronger responses. |
| Placement determines accuracy | Position monitors at breathing height, away from windows and direct sources, for readings that reflect real exposure. |
| Smart integration improves outcomes | Linking monitors to air purifiers automates protection and removes the need for constant manual checks. |
| Monitors complement medical care | Air quality data supports but does not replace allergy testing, diagnosis, or treatment from a health professional. |
What I have learned from tracking air quality alongside allergy symptoms
Most people buy an air quality monitor, glance at the numbers for a week, and then forget it exists. That is the wrong approach, and it is why so many allergy sufferers feel like the device did not help them.
The real value shows up after three to four weeks of consistent logging. I have seen families discover that their worst allergy mornings had nothing to do with pollen season. The culprit was a combination of high overnight humidity and VOC buildup from a recently installed carpet. Without the monitor data, they would have kept blaming spring. With it, they fixed the actual problem.
My advice for families with children is to start with the bedroom. Children spend more time sleeping than adults, and their airways are more sensitive to particulate exposure. A monitor in the bedroom, paired with a HEPA-grade purifier, gives you the highest return on investment of any air quality intervention. You can always expand to other rooms later.
The shift I find most valuable is moving from reactive to proactive thinking. Allergy management traditionally means treating symptoms after they appear. Monitoring means you see the conditions that cause symptoms before they hit. That is a fundamentally different relationship with your own health, and it is worth the effort to build. For families considering where to start, the immunotherapy vs air purifiers comparison is a useful read for setting realistic expectations about what each approach delivers.
— Lucas
Pureair-au products for allergy management at home
Knowing what is in your air is the first step. Removing it is the second.
Pureair-au stocks a range of AHAM-verified air purifiers, humidifiers, and dehumidifiers designed for Australian homes and the specific challenges they face, from bushfire smoke season to coastal humidity. HEPA filtration captures 99.97% of airborne particles, including the fine particulate matter that worsens allergy symptoms most. The Pureair-au Smart Finder tool matches you to the right unit based on your room size, allergy type, and local conditions. Whether you need a purifier for a child’s bedroom or a dehumidifier to control dust mite populations, the full product catalogue covers options at a range of price points. Pair your monitor data with the right filtration solution and you have a complete allergy management system built around your actual home environment.
FAQ
What does an air quality monitor measure for allergy purposes?
Air quality monitors measure PM2.5, PM10, VOCs, CO2, and humidity. These readings identify the indoor conditions most likely to trigger or worsen allergy symptoms.
Can an air quality monitor detect pollen directly?
Consumer monitors cannot identify pollen specifically. They detect pollen indirectly through PM10 readings, since pollen grains fall within the coarse particulate size range.
Where should I place an air quality monitor in my home?
Place the monitor at breathing height, roughly 1–1.5 metres off the floor, away from windows and direct pollution sources. The bedroom is the highest priority location for allergy sufferers.
How does outdoor air pollution make indoor allergies worse?
Pollutants like PM2.5, NO2, and ozone damage the airway lining, increasing its permeability. This makes allergens penetrate more deeply and trigger stronger inflammatory responses than they would in clean air.
Do I still need to see a doctor if I use an air quality monitor?
Yes. A monitor identifies environmental triggers and helps you reduce exposure. It does not diagnose allergies, identify specific allergens through testing, or replace a treatment plan from a qualified health professional.